Locative journalism: Designing a location- dependent news medium for smartphones
Authors: Lars Nyre, Solveig Bjørnestad and Bjørnar Tessem (University of Bergen, Norway) Kjetil Vaage Øie (Volda University College, Norway)
This article provides an account of the tensions between locative context-awareness and the act of writing journalistic copy for a mobile application. Based on the field trials of the interdisciplinary LocaNews project, the article discusses locative media’s potential for spatially sensitive news journalism.
In 2009 researchers in Norway made a medium design called LocaNews, and tested it out with pre-planned procedures for the two fundamental activities: production and reception. Of those who participated, 12 people worked as journalists, editors, technicians, and they generated 93 journalistic stories that were read and watched by 32 test-users who were interviewed. The pres- ent article deals with findings regarding the production of news content, and presents the strate- gies used to reinterpret the traditional news criteria of journalism to be fit for a GPS-equipped smartphone. First, the article discusses the connection between journalism and cartography, and then introduces the experimental method used for this research. The bulk of the article consists of an evaluation of the experimental attempt at practising location-dependent journalism. It deals with four issues: putting stories on the map, the characteristics of ‘zoom in stories’, the construction of an implied position for the readers, and finally the formulation of news criteria that focus on spatial proximity instead of temporal actuality.
Introduction
This article deals with the potential of GPS-equipped phones in local journalism. While not ordinarily considered a ‘locative medium’, local journalism is certainly a candidate, along with other paper-based material like resort brochures, hiking maps, roadmaps and other directions for travel. Journalists annotate the public dimension of a town, landscape or a transport infrastructure in a way that increases the citizen’s awareness and interpretation of his or her surroundings. Furthermore, the printed local newspaper is often the lifeblood of a town. It contains news often directly relevant for the reader, but nonetheless the content cannot change with the reader’s movement through the environment that the paper writes about. This is to say that local news is location-oriented, but not location-dependent. In contrast to the printed newspaper, the smartphone allows the news to change as the readers move around in their environment.
We wanted to test such location-dependence in a real setting. In 2009 we made a custom-made design called LocaNews, and tested it out at the Extreme Sports Festival at Voss, Norway, a municipality with 14,000 people, and thousands more arriving for the week-long festival in June. The LocaNews experimenters performed pre-planned procedures for the two basic activities: production and reception. On the project, 12 people worked as journalists, editors, technicians, and they generated 93 journalistic stories that were read and watched by 32 test-users. The present article deals with the production of news content, and presents our strategies for how to reinterpret the traditional local news logic as a smartphone application.
Before going into the production of news for the interface shown in Figure 1, we will first discuss the persuasive powers of journalism and cartography, and establish the communicative link between them. Then we will introduce the experimental method used for this research, which we call ‘medium design’. The latter part of the article is an evaluation of our experimental attempt at practising location-dependent journalism. It deals with four issues: putting stories on the map; the characteristics of ‘zoom in stories’; the construction of an implied geographical position for the readers; and finally, the importance of resisting the established news criteria in order to focus on proximity. We conclude that LocaNews was counter-intuitive for journalists, and our set-up is unlikely to be attempted again.
Nevertheless, there is good reason to investigate location-dependent, hyperlocal technologies in search of robust journalistic solutions for the future. National and regional newspapers suffer a crisis because of falling subscriptions to paper versions, increased concentration of ownership, and insufficient revenue from online versions. Although Norwegian local newspapers are still in a relatively strong economic position, the falling rate of paper subscription is likely to eventually weaken the local newspapers too. We propose that local journalism migrate to the mobile phone because this platform allows local newsrooms to respond more sensitively than ever to the readers’ movements through their surroundings, and is likely to become more sustainable in the future.
Journalism: Short-term reporting of social information
While maps change relatively slowly, the journalistic profession deals profusely with the newest events. At the level of social and political life, interesting variations take place in a matter of hours and days, and journalism portrays it routinely.
Journalism’s greatest merit lies in the double-check quality control and professional norms, which are sorely lacking in contemporary free-for-all forums such as blogs, Facebook profiles, and Twitter streams. Some journalism researchers suggest that professional news can be trusted more for its accuracy and objectivity than any other form of public communication, because of its strong professional ethics and venerable history (see, for example, Keen, 2007).
Journalism consists of short-term reporting of social information that can be used to update the reader on important issues and happenings in a given region of a country. It is mainly linguistic, meaning that it relies on the written and spoken word to a very large extent. This verbal dimension is expected to be truthful, well researched, autonomous, critical and relevant in a democratic way. Papacharissi (2009: vii) states that ‘It is via association that citizens are able to perform their democratic duties, and the press has been instrumental in providing citizens with the information, venues, and tools needed to associate freely and for the common good of a democratic state’.
In this article we are particularly concerned with the reporting typical of local journalism. Local news is always about people and events in a sharply limited geographical area, and this has implications for the news criteria. The national Oslo-based newspaper VG, with its 884,000 readers, has a different news agenda from the 27,000 reader strong Hordaland, which covers the Voss region. People and events are dealt with in a much closer perspective, for good and bad. The writers live in the same community as the people they write for and about, which for example means that the editor may be careful about criticizing the mayor, or may routinely refrain from writing about tragic accidents in the same tabloid style as the capital newspaper.
Although regional newspapers have very precise local coverage, this information is accessible wherever you are, and is also written in order to be potentially relevant for anybody. It seems ideal to introduce smartphone-enabled cartographic technologies into local journalism because the relevance of proximity is already so strong in the profession, and the journalists are already so familiar with their local environment.
There are interesting examples of attempts at combining cartography and news. The sociologist Robert Park in the 1920s worked with urban ecology studies, and studied cartography in order to try out how news events related to each other when their location was plotted on a map. ‘We had a diphtheria epidemic. I plotted the cases on a map of the city and in this way called attention to what seemed the source of the infection, an open sewer’ (Baker, 1973: 254). The interest in collecting public (and journalistic) information on a mapped surface was tremendously strengthened with the emergence of the internet. In the last decade, research in the field of geographical information systems (GIS) has provided sophisticated examples of movement mapping, for instance by Niihau’s (2010) and Mei-Po Kwan (2000). In relation to journalism, geo-tagging is a powerful tool. Any kind of media content can be annotated on a web-based map. While maps previously had a modest role in journalism, they have now become versatile, dynamic and very useful.
One renowned example of journalism and location-based news services is everyblock.com (EveryBlock, 2012). EveryBlock combines public data that is geo-tagged, and the users can zoom in on a map-based interface to see for example what kinds of crime are being perpetrated in their neighbourhood. In 2009, EveryBlock released a mobile application that took into consideration the users’ physical position. The application now also has a feature that allows you to draw your own geographical boundaries, called ‘custom locations’.
However, it may be difficult to introduce location-dependent journalism into the practices of local newspapers in the future. There are several reasons why this remediation process is slow, or even unlikely. Local newspapers have been the same for hundreds of years, in that they consist of printed paper and are distributed to houses and establishments by lorries and by other means, and this age-old practice cannot be expected to leapfrog to the mobile phone platform just like that. The most dramatic possibility is that local newspapers may not survive. Deuze (2007: 141) argues that journalism is coming to an end. ‘The boundaries between journalism and other forms of public communication – ranging from public relations or advertorials to weblogs and podcasts – are vanishing’. Deuze (2007), in particular, thinks that journalism is too nationalistic, ‘losing touch with a society that is global as well as local’. We believe that local newspapers will lose touch with their community and shrink in relevance if they do not take up the smartphone’s location awareness alongside their traditional editorial remit.
In addition, there may be a genuine confusion about which methods of journalism will work best in the new technological environment. There is a continuous introduction of new software and platforms, and it further fragments the opportunities for innovation. Most prominently, social media, based on the principle of locative information, have appeared in ever greater numbers since approximately 2005, notably for the iPhone, Android and Symbian smart phones with GPS (Goggin, 2011). You can now register your location in Facebook Places, Twitter, Google Latitude, Foursquare, and a host of other services. Some of the social media are starting to integrate editorial news in their cartographic applications, and in this way directly challenge local newspapers. Foursquare has made an editorial partnership with the Canadian Metro News, and the national coverage service includes restaurant reviews, city tips, to-dos and articles that mobile users can stumble upon as they traverse the landscape.
All these cross-media opportunities are genuinely confusing for the practitioners of local journalism. The offer of online news is experimental and heterogeneous, and subject to the extremes of international success and immediate obscurity. There is still no indigenous public sphere for these media, like there is for radio or television, and local journalism is unlikely to be a driving force in the innovation process. On this basis, it seems that researchers must create cartographic local journalism experimentally in order to study it at all.
Cartography: Long-term accumulation of locative information
Cartography is the skill of drawing a map, and maps in their turn are ‘graphical representations that facilitate a spatial understanding of things, concepts, conditions, processes, or events in the human world’ (Harley and Woodward, 1987: xvi). Maps consist of long-term accumulation of physical information that can be used for navigation and orientation in a landscape. The graphic design theorist Tufte is concerned about the visual ‘dimensionality and density of portrayals of information’ (Tufte, 1990: 9), and promotes maps as one of the most complex forms of visual instruction. Tufte calls cartography ‘cognitive art’, and this art form involves large amounts of images that are created and multiplied all over the world every year.
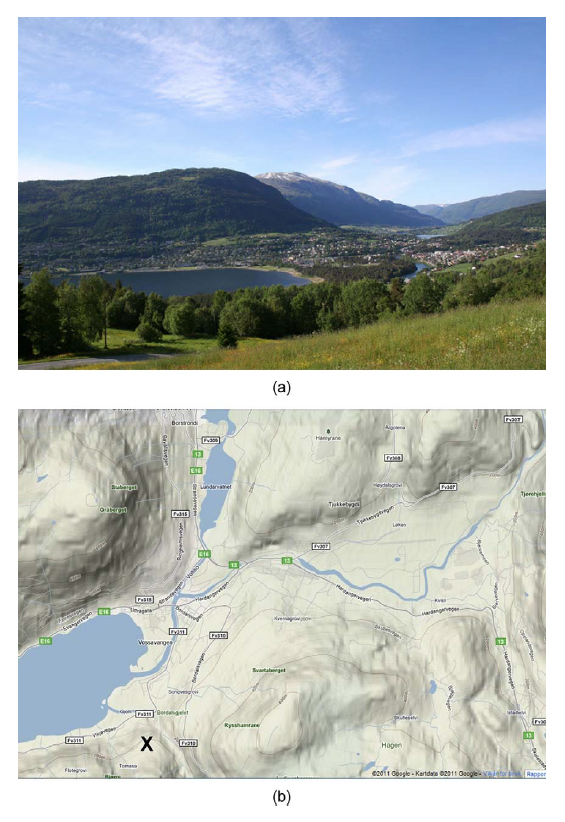
Both the photograph and the map in Figure 2 show the landscape of Voss. The map’s main function is to describe the location and characteristics of physical structures that users can expect to be there if they seek out the landscape in question (Glud et al., 2009).
Described in geographical terms, Voss is a landscape of river valleys with many mid-size rivers coming together in a lake system where Lake Vangsvatnet is the biggest at 56 m above sea level. Steep mountain slopes swing up from the valleys and the mountains peak at around 1,500 m. The peaks create a continuous natural border between civilized, cultivated land and the cold, barren mountains. In the valleys and by the lake shores wide pine forests stretch out on flat sandy ground, and small-scale farms climb the sides of the valleys with grass production for sheep and milk cows. A major road system runs from the regional centre of Bergen through Voss towards Oslo in the east, and there are several road crossings towards Sognefjorden in the north and Hardangerfjorden in the south. The railroad between Bergen and Oslo goes through Voss, and there is an airfield for private planes. The rivers are too small to support boat traffic.
Figure 3 shows that there are at least six physical layers that can be mapped in territorial maps: waterways/oceans, elevation, transport infrastructures, soil, terrain and land use. The six layers are cut through by a coordinate system, and ‘projected’ as a complete map. Figure 3 presents the type of information that is traditionally contained in paper maps, but it is important to stress that maps can also contain various types of social and historical information.
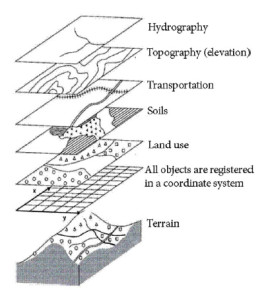
In terms of information portrayal, a map makes use of the fundamental principle that Tufte (1990: 32) calls ‘a sense of average and of variation about that average – the two fundamental summary measures of statistical data’. Figure 3 allows for an understanding of the town of Voss where the geology is expected to be very stable, while the changing weather creates seasonal variations in the hydrography. The transportation infrastructures change quite slowly, but in dramatic bursts when a new public building is erected or a new highway cuts through the landscape. In such cases, the map has to be reprinted in order to stay factual.
Territorial maps have a visual form that allows the user to navigate from point A to B without previous knowledge about B, and this in turn makes for a highly realistic understanding of one’s surroundings. Adams (2009: 193) refers to the ‘communication model’ of cartography, where a map is considered ‘a linear flow of communication through a neutral conduit’. This conception is widespread in relation to territorial maps. It is nevertheless important to remember that this realism is carefully constructed by the cartographer. Critical cartographers such as Wood and Fels (1992) and Kitchin and Dodge (2007) deconstruct assumptions about the neutrality and objectivity of maps, and claim that they are socially biased just like written texts. This conception seems particularly reasonable in relation to choropleth maps, where thematic information is portrayed. For example, different parts of a country can be shaded or patterned in proportion to the measurement of the per capita income of the citizens living there. Representing human populations on maps is a cartographic practice that has been deployed for many decades across a number of disciplines including census geography, political geography and health studies. Since the advent of the Google Maps API, there are also now plenty of online examples and mashups that use this thematic style of mapping (Gordon and de Souza e Sliva, 2011).
Medium design method
In an appeal for more empirical research on digital media, Gripsrud (2009: 15) writes that ‘the web does not warrant mystification, uncritical celebration or prejudiced condemnations. It deserves innumerable serious, theoretically informed, multifaceted, multi-method, empirical investigations’.
Before the 1990s, there was little direct contact between design science and media studies, but the increasing importance of journalism, music and video on the internet made a shared focus inevitable. In the international literature, Bolter and Grusin (1999), Nielsen (2000) and Manovich (2001) were influential in giving media students and academics a more practical understanding of computers and their communicative potential. Murdock (2005) promotes an agenda called ‘building the digital commons’, where he gives advice about how best to make new media designs for the old medium of broadcasting. Scheible, Tuulos and Ojala (2007) tested a mass participation photo art project, where 184 participants walked around in Manhattan taking photos that were shown on large public signs in Times Square. Liestøl (2009) designed an augmented reality tool for portrayal of ancient structures (Viking burial mounds, Roman buildings) that are projected into the landscape they once existed in, and Nyre (2007) designed procedures for a dialogic internet talk radio for local and national elections. They are all representatives of a tendency for researchers to shift emphasis from how artefacts ought instrumentally or rationally to function (engineering), to what they mean to those affected by them. This has also been dealt with theoretically as ‘the semantic turn’ (Krippendorf, 2006), and it is practised in education and industry as ‘interaction design’ (Sharp et al., 2007).
Scientific investigation implies that there is testing of hypotheses, monitoring and logging of activities and qualities, and various types of systematic interpretation of the material, where the aim is to draw conclusions and learn more about future options. The LocaNews project is governed by the traditional expectation that social science should be useful in and for society, combined with the constructive attitude of ‘interaction design’ (see Nyre, 2010, 2011). The core of media design is that researchers have direct, experimental contact with reality. In some cases, as in the case of locative journalism, researchers cannot analyse the ongoing events from a distance, or recapitulate their historical development, they must actually propose concrete solutions, and make functional prototypes of their proposed solutions. In the same way that a new internet banking system can be designed, implemented and tested, a new media system can also be designed, implemented and tested. And, most interestingly, since such a project deals with people and their communicative interests, it is by definition a sociological project.
In LocaNews, the main sociological challenge was journalistic. Could we formulate a reasonable instruction for the journalists working in the prototype medium? According to (Latour, 1994: 226) every technology contains a ‘program of action’, that is, a series of prescriptions for behaviour that the user must adhere to (or ignore at their peril). We wanted to construct a spatially oriented program of action. The design method for LocaNews can be summed up in three phases:
1. Build a functional medium design. The LocaNews project is based on two separate interfaces specially tailored for journalists and readers respectively. The interfaces were called the LocaWriter and the LocaReader. The first is the editorial software for journalists, photographers and editors (Stavelin, 2009), where all the text and photos are uploaded, and the layout is generated. The second is the reader software for mobile phone users, where people select news stories and scroll through, reading the news (Leirvaåg, 2009). The LocaReader was first programmed in the Python programming language for Nokia Symbian smartphones, and then rewritten into the C++ programming language to be run on the same phones. In newer versions, made after the 2009 experiments, the software runs on Android smartphones and is programmed in Java. This simple structure of production-reception makes LocaNews a strictly one-way medium, without channels for feedback from readers. The programming and design choices of LocaNews are analysed in Bjørnestad, Tessem and Nyre (2011a).
2. Make procedures for content-production. LocaNews was organized to simulate the productive capacity of an average Norwegian local newspaper. The staff consisted of 13 people, including technicians, editors, journalists and photographers. Five journalists worked full time during the week-long experiment, with an editor and technical support. All photos and journalistic copy were published under the auspices of a responsible editor. Since our focus was the new type of locative content and the news criteria associated with it, we made no attempt at being innovative at the organizational level. LocaNews had a desk editor, journalists who worked in teams with a writer and a press photographer, and the news was presented with a catchy headline, lead and journalistic copy (see Deuze, 2011 for an overview of essential journalistic practices).
3. Evaluate the design in a public setting. It is valuable for the researcher to have members of the general public trying out the design. LocaNews needed people who could function as readers of the news while moving in and around Voss. We exposed a sample of 32 people to the service, and monitored their behaviour with a questionnaire and observation notes. We gave the users access to the phone and the application for one-to-two hours. The participants had to conform to a certain set of procedures that we were testing, but there were no limitations on their behaviour beyond this (for interesting projects in the same vein, see Gjedde and Ingemann, 2008, and Elwood and Martin, 2000). The LocaNews user evaluations are analysed in Bjørnestad, Tessem and Nyre (2011b) and Øie (2011).
It seems necessary to stress that LocaNews is not action research. This tradition is typically conceived of as being active in the sense of improving the conditions for behaviour and experience in an involved group. This can be making a business staff more efficient because they are made to enjoy work more (Gustavsen, 2001), or teaching discriminated immigrants how to cope better with their situation (Fals Borda, 2001). However, LocaNews only involved the participants for one week at Voss, and the production unit was shut down permanently after the festival. LocaNews did not aim to change the lives of any particular social group; we only wanted to learn about the reactions of some individuals in order to assess the viability of our procedures for location- dependent journalism.
Because of the large amount of data from LocaNews, we will specify that the following analyses are based on four data types: summaries of exemplary news stories; statistical data about the entire text corpus; screen shots from the two software programs; and, illustrations of cartographic/navigational features. LocaNews is not just textual, but has also two important graphical information types: photographs and positions and directions on maps. In this article the graphical dimension is paramount, and the figures are essential to our report, and should be considered core evidence. A partial goal in the following is to develop a vocabulary for analysing locative journalism.
Procedures for journalistic location sensitivity
LocaNews introduces cartography in the journalistic practice in order to rehearse a skill that is likely to become more important in the future, namely (professional) location sensitivity. For one week in June 2009, the town of Voss was filled with thousands of athletes, volunteer staff, onlookers and ordinary tourists, and for the same duration we made a special news service appealing to their location sensitivity. The swollen population was a good test case for LocaNews, and we established our newsroom in the morning on a Sunday, and packed it down on the following Saturday night.
We worked with three information types in order to cultivate location sensitivity among our journalists: proximity to a location plotted on a map; photographs of people, places and events; and descriptions and arguments written in journalistic form. Proximity was registered in the form of GPS-signals generated by the movements of the users, which the researchers used to generate a relevant priority of news. Photographs, descriptions and arguments were made more or less in accordance with standard professional values, since this was not our main testing ground.
LocaNews mainly contained news from the centre of Voss, although some news locations were further afield. The base-jumping events in Gudvangen and ski-railing competition at Vikafjell were both at least 40 km away in different directions.
The analysis deals with four issues that turned out to be quite challenging for the research team: putting stories on the map; creating the genre ‘zoom in stories’; constructing an implied position for the readers; and, creating specifically locative (as opposed to temporal) news criteria.
1: Putting stories on the map
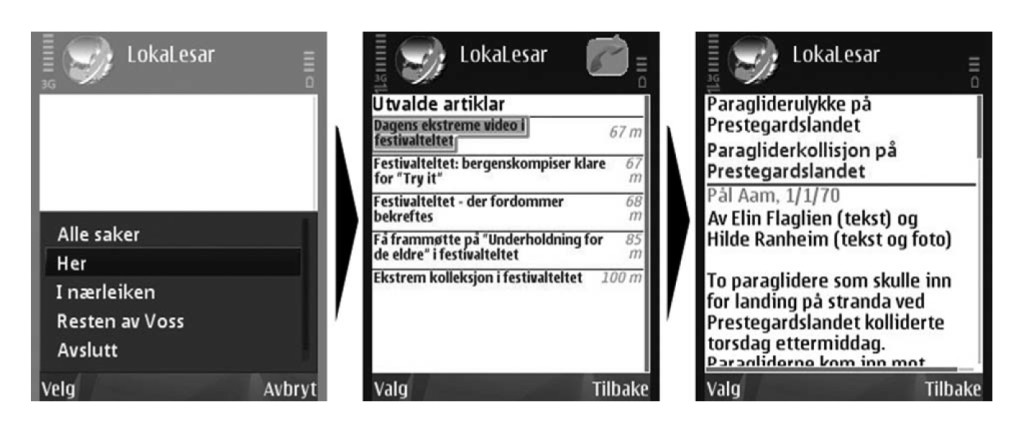
How did LocaNews work? Imagine that you have a Nokia N95 in your hand. The software is running and a menu appears. The LocaReader gives you a choice of stories from Here, Nearby and Voss at large. If you choose ‘Here’ the stories that are located in a radius of 100 m from your position will be filtered out and presented.
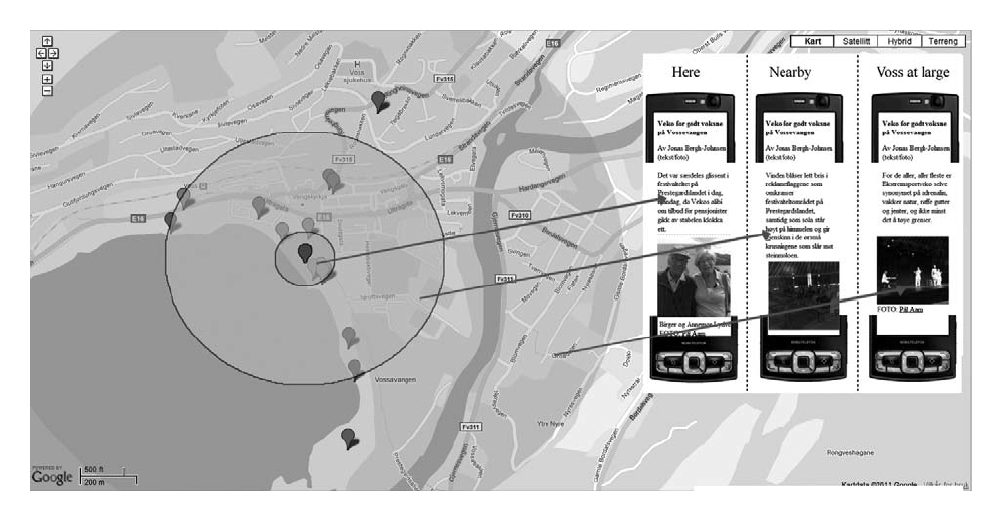
In fact LocaNews contains three versions of the same story. Whichever story you are reading in the ‘here’ mode, there are two more versions that are not displayed in the software: one which is only available if you are 100–500 m away, and one which is only available if you are more than 500 m away. These three proximity zones are illustrated in Figure 4. Owing to restrictions in the software, the reader could only access the article that corresponded to his or her location within the three-way division of geographical space. The LocaReader could have been constructed to give access to all three versions at the same time, but we chose the mutually exclusive solution in order to force a sense of context-dependency on users. The LocaReader had no help text that explained this significant feature, and the readers could only discover the differentiation by moving around and discovering that this would cause the story to be presented in different ways.
The three-version approach to journalism was the crucial context-aware feature of LocaNews, because it follows movements ‘towards’ and ‘away from’ that are a constant of travelling and moving around. The journalists were supposed to work from a systematic differentiation between the three scales of proximity, and to make this the fundamental distinguishing feature. News criteria, types of photographs, choice of sources, writing style and so on would be tailored to the three- levels of proximity distinction.
It turned out to be a real challenge to make rules for location-aware journalism. The newsroom didn’t succeed in developing the analytic rigour required to distinguish systematically between three areas of proximity to the event. For example, the same headline and picture was often used in all three stories although it was possible to differentiate, and this expressed relatively weak location-sensitivity among the staff. Several topics were treated in the same writing style across the three versions – especially the descriptive style where an arena, concert hall or town square was presented in exactly the same way in all three versions. It was difficult to find good criteria for differentiating between them in a journalistically relevant way. Furthermore, none of our news writers were locals, and they lacked the familiarity with landscapes and social life bred from permanent habitation in Voss. These factors made it difficult for the journalists to become truly attuned to nuances associated with life in Voss.
2: Zoom in stories
We learnt that there were ways of dramatizing the three-version story into simple narratives, and developed one such narrative in a comprehensive way. Zoom in stories are written to encourage the reader to walk or drive to a certain location in Voss because there is a particularly interesting thing to see there. One story deals with a PR stunt related to the festival: The Bula clothes company has hung a mock-up clothesline across a river canyon. It is more than a kilometre long, and the clothes hang 40 to 60 m down in the gorge, and it is visible from parts of central Voss.
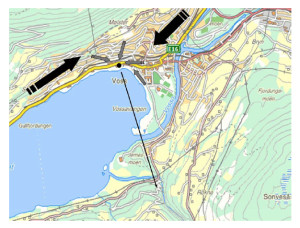
Regardless of how far away you are you can read the version called Voss at large. The planned news criterion is that you cannot see the news location, and the news is written to be interesting for anyone who is in Voss, or who approaches Voss on the roads or the railway. The two thick black arrows in Figure 5 show the intended direction of travel. This far-away version should have a critical perspective and focus on decision makers and other powerful persons and organizations. This version of the clothesline story contains critical opinions about the spectacle, in that several people voice objections to the ugliness of the spectacle and argue that it should not have been allowed. This presumably increases the curiosity of the readers, and makes them want to see it for themselves.
You have to be nearer than 500 m to access the version called Nearby. You may be able to see the news location, and maybe not. The planned news criterion was that this version is written to capture the social mood in a given neighbourhood, and to write about its influence on the news story in question. You can walk to the exact location of the story in a matter of minutes, if the story captures your interest. The grey arrows in Figure 5 show the intended direction of travel. The clothesline story is located in the neighbourhood where you can best see the clothesline from across the lake. There are interviews with tourists, local people and cafe´ guests, who all have an opinion about the clothesline. The best position for looking at it is described, and the reader is encouraged to go there.
You have to be nearer than 100 m to read the version called Here. The black point in Figure 5 marks the reader’s implied position. The planned news criterion was that interviews and witness reports are written in a personal way, to increase the sense of presence. Not only can you see the news location, you are so close that you can touch and handle the news topic, walk around and look at the context, and, by reading the story, learn what has happened or may happen right here in the future. The ‘here’ version of the ‘Clothesline saga’ basically confirms that you have reached the best visual position, and can now enjoy the recommended spectacle with maximum effect. The written story contains background information on how they have stretched the wire across the canyon, and other facts that presume the heightened interest of a person who is looking at it right now.
The zoom in procedure is the most explicitly ‘location dependent’ facet we were able to create during the LocaNews experimental phase. It would work well, for example, for drawing tourists towards sights of public interest, like a waterfall, a special building or an installation artwork. Based on the experimental procedures, we see that future iterations must have several different narratives that are pre-planned, and which all help to differentiate better between the three levels of proximity. There have to be intuitively graspable differences between the three levels if they are to succeed in creating a realistic sense of context-awareness.
Source: authors, based on Google Maps.
3: Constructing the implied position
The biggest challenge was that locative journalism requires a strong sense of location sensitivity in order to realize its potential. The stories have to be written (and photographed) in a way that creates good bearings for the readers, and the ‘here’ story should preferably create a sense of what navigators call ‘point position’. This means that you know exactly where you are. ‘You can use that knowledge to identify on the map any major feature that you can see in the landscape. You can also identify in the landscape any major visible feature that is shown on the map’ (Burns and Burns, 2004: 47). We will discuss three practical dimensions of constructing the point position: finding the interesting places and events to cover journalistically, taking photographs that give the right sense of presence and display the reader’s position in relation to the location that the journalists are describing (the implied or point position).
For the editorial staff, the job of locating the story on the map was a crucial part of its production. The journalists used the hybrid and roadmap functions of Google Maps to find the best location for the story. In technical terms this was an easy job.
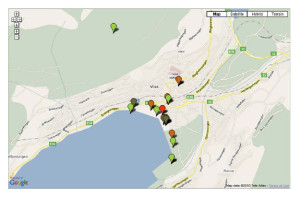
We also supported a journalistic perspective on what has been ‘covered’ (Figure 6). The map in the LocaWriter was progressively saturated with news stories represented by flags, with different colours signifying the genres ‘news’, ‘culture’ and ‘sports’. Sometimes it was difficult for journalists to give the story a position because the map didn’t match the terrain, especially not at very close range.
Figure 7 shows a photograph from a story about a paraglider crash. The photograph quite realistically represents the point of view of somebody who was actually at the scene of events. The journalist is a witness in the traditional sense, and the story constructs the reader as being present at the scene. The news item in Figure 7 looks much like ordinary web journalism, except that the reader is likely to read it hours or days after the accident happened and in the same place that it happened.
It was very difficult to photograph the two outer zones in a meaningful way. Landscape and overview photos were impractical on the small screen as all the details disappeared. The quantitative analysis shows that the photos tend to represent social gatherings. The photo of a man being carried on a stretcher is a good example. Only 8% of the photos were landscapes (and 3% were portrait photos); 68% of the first photos in a story deal with activities and persons in a semi-total frame, which means that the bodies of several people are captured, along with features such as cars, paragliders, bridges and so forth. Photos were overall the most successful feature of our journalism, especially in the ‘here’ zone. They gave a strong sense of presence to the news stories.
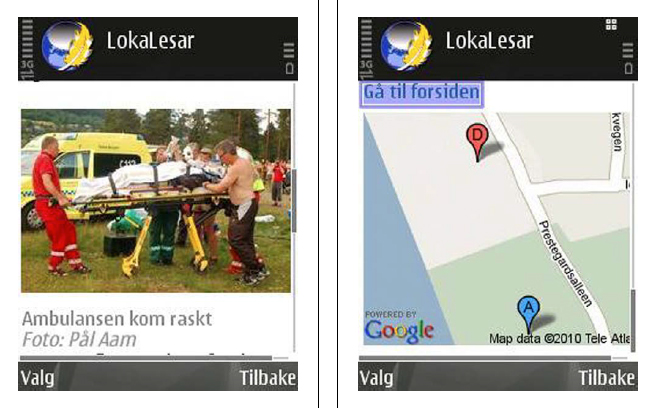
Figure 8. The LocaReader’s display of your position (D) in relation to the news story (A). In the top left corner it reads ‘Return to front page’. Source: authors, based on Google Maps.
In LocaNews there is a positioning map at the bottom of all news stories, and the relationship between the two marked positions has an important function. With yourself as a reference point you can move around in this parallel journalistic sphere and see how the information density increases or decreases with your movements. Notice that this differentiation required that the users reload the story after relocating themselves; it displays the navigator’s position relative to the various news stories in the vicinity.
Studying the map in Figure 8, the user can look around and identify geographical markers like the road, the shoreline and the border zone between the park and the sand dunes. This is a topologization of information where ‘mapping’ is not meant metaphorically as some form of compartmentalization of thoughts and ideas, but geographically as a placement of claims and facts in suitable locations (Brennan-Horley et al., 2010).
The visualization of the reader’s position (D) in relation to the event (A) was generated automatically, and was not actively used by the LocaNews production team. This directional map could have had a more prominent function, for example as the main principle for organizing the articles (instead of a list). The layout and typography of LocaNews resembled the designs of established online news too much. The way of thinking and writing was dominated by the perceived need for a snappy headline, short lead, and inverted pyramid report, and this made it even more difficult to write with proximity as the main news criterion.
4: Locative news criteria
LocaNews’s journalistic ambitions at the outset were to make the news criterion proximity into the primary criterion for selection of news stories, and then to write three highly diferentiated versions of the news, where traditional writing styles and priorities were followed. This has been described in detail earlier in this article. Along with the mobile display, this strategy would presumably create a very high sense of relevance for readers. After the completion of the experiment, we no longer have such ambitions. It turned out to be very difficult to resist the established news criterion of temporal actuality in order to focus on spatial proximity, and we encountered four problems in particular. They were confirmed by a quantitative analysis of the 93 stories (Klausen, 2011).
1. Events, not structures. Since LocaNews deals with places, we registered the kinds of places identified in the news stories. Of the stories, 26% took place by a riverbed, which can be explained by the many events involving riverboats, and also by the welcoming flat terrain along the rivers and lakes, where most of the infrastructure is located. A further 40% of the stories were located on mountain tops, hillsides and along the lakes, which are also important venues for sports such as biking, skiing, kiting among others. A meagre 20% of the stories took place in public places, buildings or in private homes.
2. Sociability, not politics. We rated the news stories according to what type of description was dominant, and found that social surroundings and activities dominated in 46%, other people’s action in 37.6%, and the larger geographical surroundings in only 7.5% of the stories. This reflects the types of events that are considered newsworthy at a festival, where some hundreds of people gather around a pivotal activity for a few hours, then disperse and gather anew at another venue. Our journalists captured this laid-back migration through the landscape without using the first- person perspective; only 5% of the stories were dominated by the journalist’s own experience.
3. Observation, not analysis. During the experimental production period the journalism turned out to be observational rather than analytical. The statistics show that uncontroversial issues like outdoor life, sports, tourism and entertainment make up 80% of the content, while journalism with a focus on culture makes up an additional 13%. The bias towards colourful descriptions without back- ground research is shown by the fact that the average number of photos in LocaNews was 2.8, while the average number of interviewees was 0.9. A more investigative method would imply talking to many people and checking many facts before writing the story, and this strategy would have increased the average number of interviewees.
4. Positive, not negative bias. We rated all stories on the felt bias of the story, and 13% were strongly positive, 46% positive, 40% neutral and only 1% raised a confrontational perspective on the given topic. There was 0% coverage of presumably controversial issues like municipal economy, business reports, agriculture and crime. The lack of investigative attitude also shows in the analysis of how many sources the news stories had. A whopping 37% of the articles had no sources, while 26% were festival organizers, 15% athletes, and 9% audience members. The rest was made up of business people and media workers, but none of the locals were politicians, policemen or other officials.
These facts suggest that LocaNews became an information service for a festival instead of an independent news organization. The news criteria of conflict and polarization were not at all central to our journalism. This can partly be attributed to the enthusiastic ethos that the Extreme Sports Festival has in the public eye. Especially journalists and media professionals tend to like it a lot, mainly because there are endless photo opportunities with dramatic sports action and beautiful natural scenery. This visual abundance tends to undermine the motivation for writing properly critical journalism about the arrangement and its local implications. There is an element of ad-hoc loyalty at work, and it is even practised by presumably disinterested journalists who find them- selves caught by the ‘good vibrations’, the wonderful weather and the smooth organization of events. By the way, this kind of patriotism is typical of local Norwegian newspapers.
Conclusion
What did we learn from the LocaNews project? Although it may be easy to design a medium that affords location-dependent journalism, it is very difficult to reorient the established journalistic procedures and textual conventions so that they effectively exploit the possibilities of the new medium. It is easier to design a new technology than to establish a new journalistic practice.
Locative journalism is a very different writing practice from traditional local journalism. Our journalists had problems adapting to the news criteria related to the three levels of context- awareness. It seemed to be almost counter-intuitive for journalists to work with news criteria based on spatial proximity rather than temporal actuality. Brian Winston’s ‘law of suppression of radical potential’ describes the social mechanism that we encountered in our own practices during the LocaNews experiments. Constraints operate to reduce the level of unfamiliarity to a minimum, and to ‘slow the rate of diffusion so that the social fabric in general can absorb the new machine and essential formations such as business entities and other institutions can be protected and preserved’ (Winston, 1998: 9). Along the way the radical potential for location-dependent journalism is likely to be watered down, and the public is left with a less sensitive conception of local space than it could have had. Journalists need more precise knowledge of locations and their differences, and the ability to use this knowledge in a critical way, something which can really only come about through long-term education and adoption of locative journalism in the profession itself.
References:
Adams PC (2009) Geographies of Media and Communication. A Critical Introduction. Oxford: Wiley- Blackwell.
Baker PJ (1973) The life histories of WI Thomas and Robert E Park. The American Journal of Sociology 79(2): 243–260.
Bernhardsen T (2006) Geografiske informasjonssystemer [Geographic Information Systems]. Nesbru: Vett og viten.
Bjørnestad S, Tessem B and Nyre L (2011a) Design and evaluation of a location-based mobile news reader. In: Proceedings of the 4th IFIP Internatioanl Conference on New Technologies, Mobility, and Security, Paris, France, 7–10 February 2011, pp. 278–282. Paris: IEEE.
Bjørnestad S, Tessem B and Nyre L (2011b) Experimental evaluation of tools and concepts for location-aware journalism. e-Society 2011, IADIS International Conference, Avila, Spain, 11–13 March.
Bolter J and Grusin R (1999) Remediation: Understanding New Media. Cambridge, MA: MIT Press. Brennan-Horley C, Luckman S, Gibson C et al. (2010) GIS, ethnography, and cultural research: Putting maps back into ethnographic mapping. The Information Society 26(2): 92–103.
Burns B and Burns M (2004) Wilderness Navigation. Finding Your Way Using Map, Compass, Altimeter and GPS. Seattle, WA: Mountaineers Books.
Deuze M (2007) Media Work. Cambridge: Polity.
Deuze M (ed.) (2011) The Routledge Companion to News and Journalism. London: Routledge.
Elwood S and Martin D (2000) Placing interviews: Location as a consideration in doing qualitative inter- views. The Professional Geographer 52(4): 649–657.
EveryBlock (2012) Available at: www.everyblock.com (accessed 7 June 2012).
Fals Borda O (2001) Participatory (action) research in social theory. Origins and challenges. In: Reason P and Bradbury H (eds) The SAGE Handbook of Action Research. Participative Inquiry and Practice. London: SAGE, pp. 27–37.
Gjedde L and Ingemann B (2008) Researching Experiences: Exploring Processual and Experimental Methods in Cultural Analysis. Cambridge: Cambridge Scholars Publishing.
Glud LN, Albrechtslund A and Harder H (2009) The Persuasive Qualities of Maps. Persuasive’09, Proceedings of the 4th International Conference on Persuasive Technology, Claremont, CA, USA, 26–29 April, article 27. Available at http://dl.acm.org/citation.cfm?id¼1541948 (accessed 7 June 2012).
Goggin G (2011) Global Mobile Media. London: Routledge.
Gordon E and de Souza e Silva A (2011) Net Locality. Why Location Matters in a Networked World. Oxford: Wiley-Blackwell.
Gripsrud J (2009) Digitising the public sphere: Two key issues. Javnost – The Public 16(1): 5–16. Gustavsen B (2001) Theory and practice. The mediating discourse. In: Reason P and Bradbury H (eds) The SAGE Handbook of Action Research. Participative Inquiry and Practice. London: SAGE, pp. 17–27. Harley JB and Woodward D (1987) The History of Cartography. Cartography in Prehistoric, Ancient, and Medieval Europe and the Mediterranean. Chicago, IL: University of Chicago Press.
Keen A (2007) The Cult of the Amateur : How Today’s Internet is Killing our Culture. New York: Doubleday/ Currency.
Kitchin R and Dodge M (2007) Rethinking maps. Progress in Human Geography 31(3): 331–344.
Klausen R (2011) Lokasjonsstyrte medietekster for mobile medium [Location-guided media texts for mobile media]. Unpublished batchelor thesis, Volda: University College of Volda.
Krippendorf K (2006) The Semantic Turn. A New Foundation for Design. New York: Taylor & Francis. Kwan M-P (2000) Analysis of human spatial behavior in a GIS environment: Recent developments and future prospects. Journal of Geographical Systems 2(1): 85–90.
Latour B (1994) Where are the missing masses? The sociology of a few mundane artifacts. In: Bijker W and Law J (eds) Shaping Technology/Building Society. Studies in Sociotechnical Change. Cambridge, MA: MIT Press, pp. 225–258.
Leirvaåg C (2009) Lokaleser – brukersentrert design av en lokasjonssensitiv mobilapplikasjon [LocaReader – user centered design of a location sensitive mobile application]. Unpublished masters thesis, Bergen: University of Bergen.
Liestøl G (2009) Situated simulations: A prototyped augmented reality genre for learning on the iPhone.
International Journal of Interactive Mobile Technologies 3(SI1): 24–28. Manovich L (2001) The Language of New Media. Cambridge, MA: MIT Press.
Murdock G (2005) Building the digital commons. Public broadcasting in the age of the internet. In: Lowe G and Jauert P (eds) Cultural Dilemmas in Public Service Broadcasting. RIPE@2005. Go¨ teborg: Nordicom, pp. 213–231.
Neuhaus F (2010) UrbanDiary – a tracking project capturing the beat and rhythm of the city: Using GPS devices to visualise individual and collective routines within central London. The Journal of Space Syntax 1(2): 315–336.
Nielsen J (2000) Designing Web Usability: The Practice of Simplicity. Indianapolis, IN: New Riders Publishing. Nyre L (2007) Minimum journalism. Experimental procedures for democratic participation in sound media. Journalism Studies 8(3): 397–413.
Nyre L (2010) Experimenting with new media for journalism. Nordicom Information 32(2–3): 83–93.
Nyre L (2011) Medium design considered as a method for research on new media. Paper presented at Nord- Media 2011 Conference in Akureyri, Iceland, August 11–13.
Øie KV (2011) A sense of news. Investigating user experiences when reading locative news. Paper presented at NordMedia 2011 Conference, Akureyri, Iceland, August 11–13.
Papacharissi Z (2009) Journalism and Citizenship. New Agendas in Communication. New York: Routledge. Scheible J, Tuulos V and Ojala T (2007) Story Mashup: Design and Evaluation of Novel Interactive Story- telling Game for Mobile and Web Users. In: Proceedings of MUM07, The 6th International Conference on Mobile and Ubiquitous Multimedia, Oulu, Finland, 2007. Available at: http://www.mobilenin.com/myweb/publications/StoryMashup_MuM07.pdf (accessed 10 June 2012).
Sharp H, Rogers Y and Preece J (2007) Interaction Design: Beyond Human-Computer Interaction. Chichester: John Wiley.
Stavelin E (2009) Utviklingen & evalueringen av LokaNytt CMS – et informasjonssystem for lokasjonssen- sitive journalistiske tekster for mobiltelefon [Development & evaluation of LocaNews CMS – an information system for location sensitive journalistic texts for the mobile phone]. Unpublished masters thesis, Bergen: University of Bergen.
Tufte ER (1990) Envisioning Information. Cheshire, CT: Graphics Press.
Winston B (1998) Media Technology and Society. A History From the Telegraph to the Internet. London: Routledge.
Wood D and Fels J (1992) The Power of Maps. New York: The Guilford Press.